Chi Square
Quick reference
Make informed decisions
Data analysis
Data driven decision making
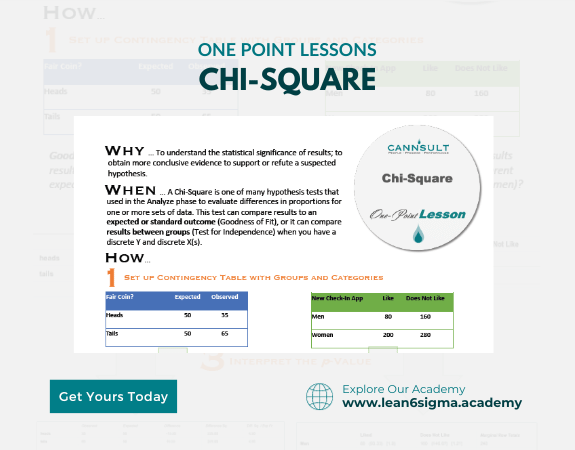
The Chi-Square Test is a statistical tool used to analyze categorical data and assess whether there's a significant association or difference between variables.
Description:
The Chi-Square Test is a statistical test used to determine if there's a relationship or association between two or more categorical variables. It helps researchers and analysts make informed decisions based on observed data.
Steps:
Define the Research Question: Clearly state the research question or hypothesis. For example, you may want to know if there's an association between two categorical variables.
Collect Data: Gather data that is organized into categories or groups. This data should represent the variables of interest.
Create a Contingency Table: Construct a contingency table (also known as a cross-tabulation or crosstab) that organizes the data into rows and columns, with each cell representing the frequency of observations for a specific combination of categories.
Calculate Expected Frequencies: For each cell in the contingency table, calculate the expected frequency under the assumption of no association (i.e., if the variables are independent).
Calculate the Chi-Square Statistic: Compute the Chi-Square statistic by comparing the observed frequencies to the expected frequencies for each cell in the table.
Determine Degrees of Freedom: Calculate the degrees of freedom for the Chi-Square test based on the dimensions of the contingency table.
Set Significance Level (α): Choose a significance level (usually 0.05 or 0.01) to determine the threshold for statistical significance.
Compare Chi-Square Statistic: Compare the calculated Chi-Square statistic to the critical value from the Chi-Square distribution table at the chosen significance level.
Interpret the Result: If the calculated Chi-Square statistic is greater than the critical value, you can reject the null hypothesis, indicating a significant association between the variables.
Report Findings: Communicate the results, including the Chi-Square statistic, degrees of freedom, and p-value, in a clear and concise manner.
Benefits:
Assessment of associations in categorical data
Identification of significant relationships
Data-driven decision-making
Key Takeaway:
The Chi-Square Test is a valuable statistical tool for analyzing categorical data and determining whether there's a significant association or difference between variables. It aids in making informed decisions and drawing meaningful insights from data.
0 Reviews
Riaan is a dynamic leader, coach, facilitator, Lean Six Sigma Master Black Belt with over 20 years of hands-on experience driving business results. Riaan is highly skilled and has worked across diverse industries internationally. With a degree in Chemical Engineering, Riaan started in the major breweries and bakeries in South Africa and was so dedicated to his work that he was often known to take his work home with him.