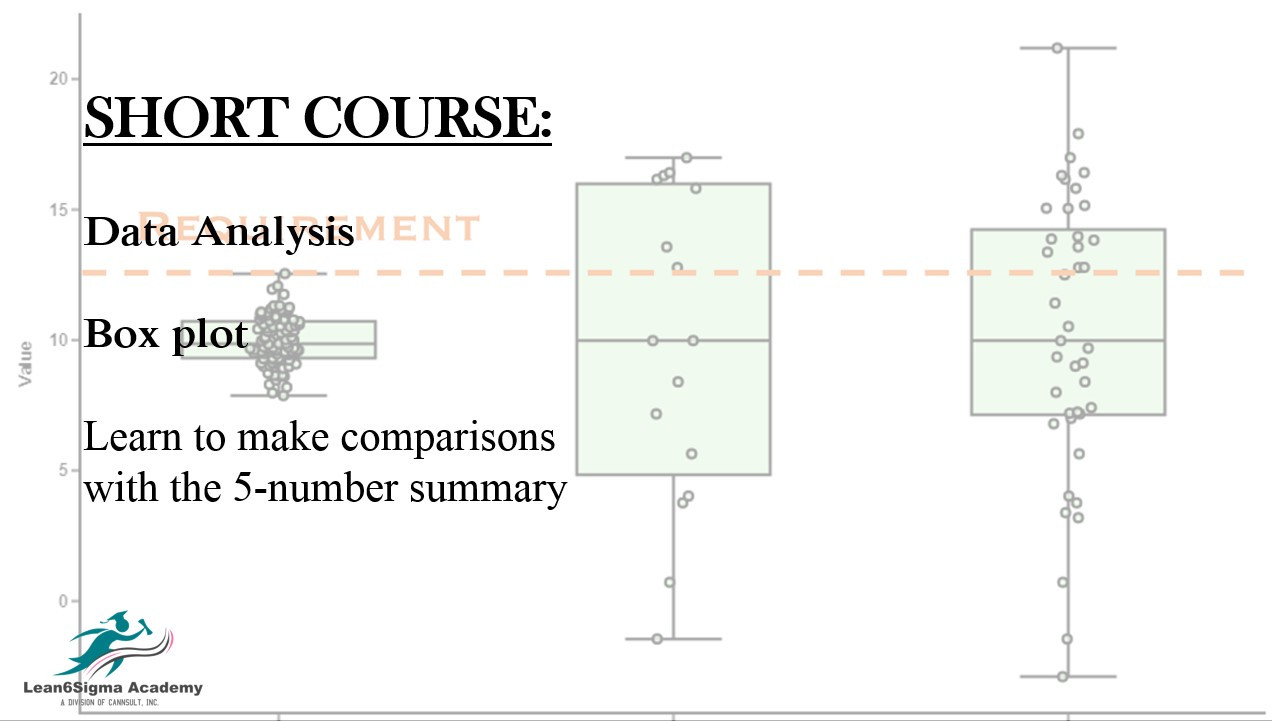
Box Plot
Why use Box Plots?
Interpreting a Box Plot:
What is a Box Plot?
When to use Box Plots in data analysis.
Whiskers!
Course Content:
Introduction to Box Plots
What is a Box Plot?
Why use Box Plots?
When to use Box Plots in data analysis.
Data Preparation:
Identifying the dataset to be analyzed.
Cleaning and preparing the data for Box Plot creation.
Box Plot Components:
Understanding the key elements of a Box Plot: the box, whiskers, median, quartiles, and outliers.
Interpreting the distribution of data using a Box Plot.
Creating a Box Plot:
Steps to construct a Box Plot manually or using software (e.g., Excel, Python, R).
Customization options for Box Plots.
Interpreting a Box Plot:
Analyzing a Box Plot to identify central tendency, spread, and skewness in the data.
Detecting potential outliers and understanding their significance.
Participants work with sample datasets to create and interpret Box Plots.
Comparing Data Sets with Box Plots:
Using Box Plots to compare the distributions of multiple data sets.
Understanding the implications of differences in Box Plots.
Real-World Applications:
Sharing case studies and real-world examples of using Box Plots in various fields (e.g., finance, healthcare, education).
Common Mistakes and Pitfalls:
Identifying and avoiding errors in Box Plot construction and interpretation.
0 Reviews
Riaan is a dynamic leader, coach, facilitator, Lean Six Sigma Master Black Belt with over 20 years of hands-on experience driving business results. Riaan is highly skilled and has worked across diverse industries internationally. With a degree in Chemical Engineering, Riaan started in the major breweries and bakeries in South Africa and was so dedicated to his work that he was often known to take his work home with him.