Pareto Chart
What is a Pareto chart?
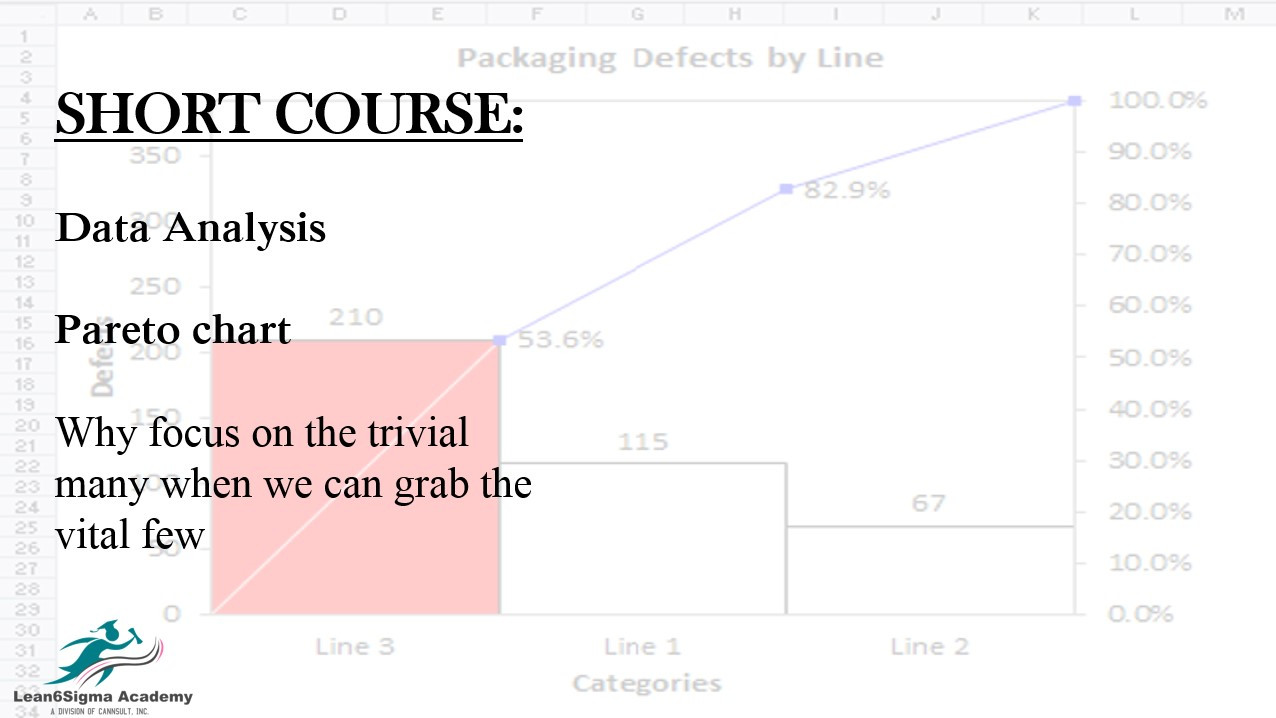
Creating a Pareto Chart
Using Pareto Charts in Problem Solving
80:20 Rule
When and why to use Pareto charts.
Interpreting a Pareto Chart
Real-World Applications
Course Content:
Introduction to Pareto Charts:
What is a Pareto chart?
The history and significance of the Pareto principle (80/20 rule).
When and why to use Pareto charts.
Data Collection and Preparation
Identifying the problem or issue to be addressed.
Gathering relevant data.
Organizing and categorizing data.
Creating a Pareto Chart
Steps to construct a Pareto chart.
Choosing appropriate categories and criteria for analysis.
Constructing the chart (e.g., using software or Excel).
Interpreting a Pareto Chart
Analyzing the Pareto chart to identify the most significant factors.
Understanding the importance of the cumulative percentage.
Recognizing the vital few versus the trivial many.
Participants work with sample data to create and interpret Pareto charts.
Discussing practical examples and insights.
Using Pareto Charts in Problem Solving
How Pareto charts aid in decision-making and prioritization.
Developing action plans based on Pareto chart findings.
Monitoring and evaluating the impact of implemented changes.
Real-World Applications
Common Mistakes and Pitfalls
Identifying and avoiding errors in Pareto chart construction and interpretation.
Tips for effective use.
0 Reviews
Riaan is a dynamic leader, coach, facilitator, Lean Six Sigma Master Black Belt with over 20 years of hands-on experience driving business results. Riaan is highly skilled and has worked across diverse industries internationally. With a degree in Chemical Engineering, Riaan started in the major breweries and bakeries in South Africa and was so dedicated to his work that he was often known to take his work home with him.