Run and Control Charts
When to use Run Charts.
Interpreting Control Charts:
Setting control limits:
What is a Run Chart?
Creating and interpreting Run Charts.
Creating Control Charts:
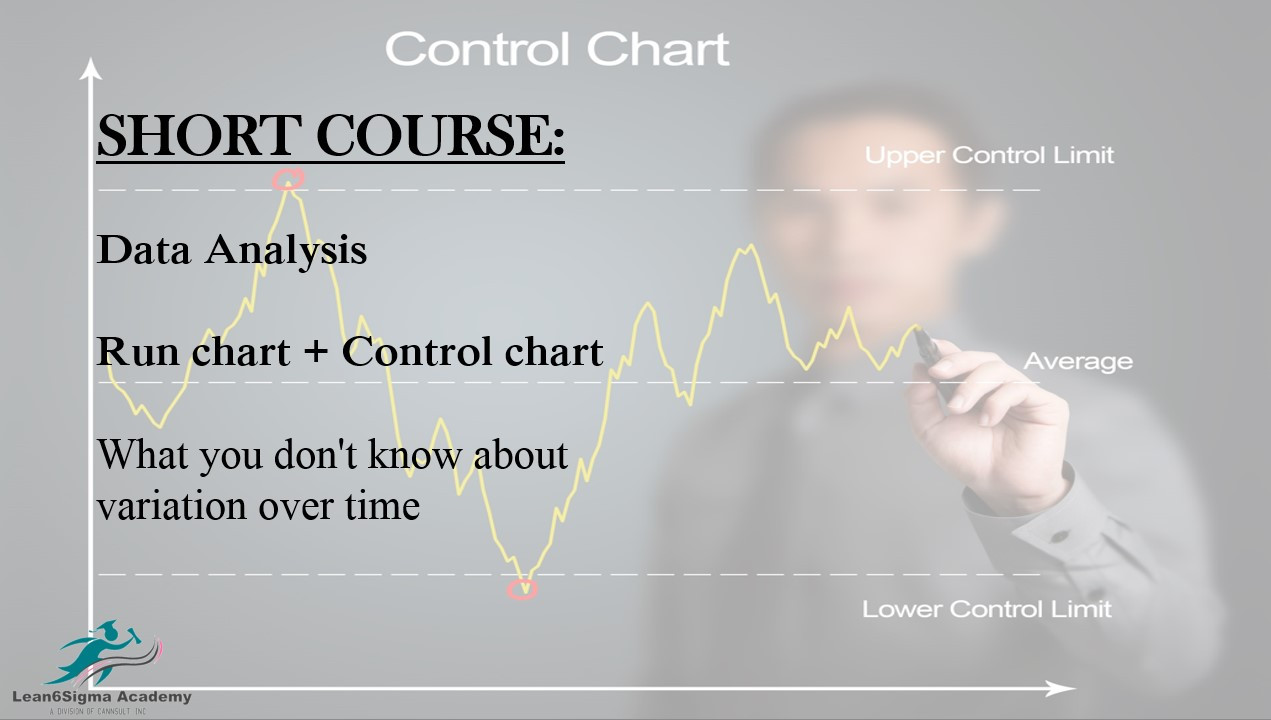
Course Content:
Introduction to Run Charts and Control Charts:
Explanation of Run Charts and Control Charts.
Their significance in process monitoring and improvement.
Run Charts:
What is a Run Chart?
When to use Run Charts.
Creating and interpreting Run Charts.
Detecting patterns and trends in Run Charts.
Hands-On Practice: Creating and Interpreting Run Charts
Participants work with sample data to create and analyze Run Charts.
Discussing practical examples and insights.
Control Charts:
Introduction to Control Charts.
Different types of Control Charts (e.g., X-bar and R charts, p-charts, c-charts).
Selecting the appropriate type of Control Chart based on data characteristics.
Creating Control Charts:
Steps to construct Control Charts manually or using software.
Setting control limits:
Understanding process variation and control.
Interpreting Control Charts:
Analyzing Control Charts to assess process stability.
Identifying common cause and special cause variation.
Taking appropriate action based on Control Chart signals.
Hands-On Practice: Creating and Interpreting Control Charts
Participants work with sample data to create and interpret Control Charts.
Discussing practical examples and insights.
Real-World Applications
0 Reviews
Riaan is a dynamic leader, coach, facilitator, Lean Six Sigma Master Black Belt with over 20 years of hands-on experience driving business results. Riaan is highly skilled and has worked across diverse industries internationally. With a degree in Chemical Engineering, Riaan started in the major breweries and bakeries in South Africa and was so dedicated to his work that he was often known to take his work home with him.