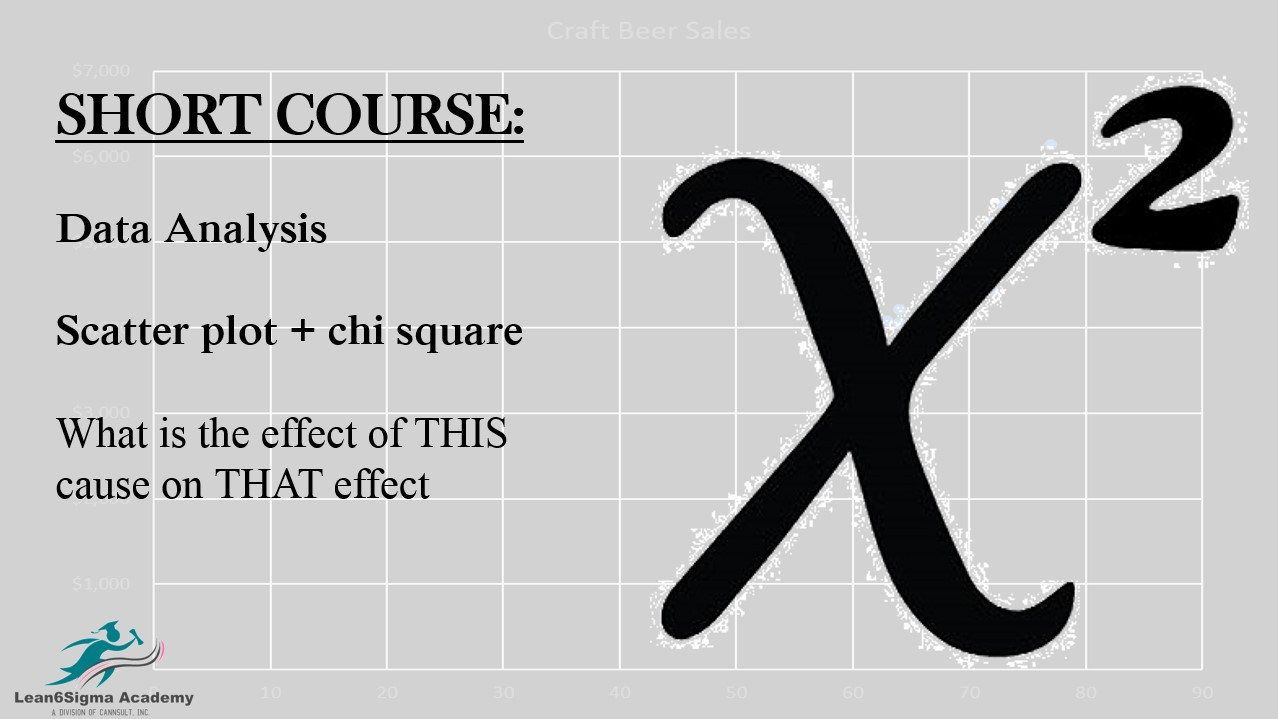
Chi Square
Goodness of Fit
Interpreting Chi-Square results.
What is the Chi-Square test?
Scatter Plot
Test of Independence
Understanding the contingency table.
What is a scatter plot?
Course Content:
Introduction to Data Analysis
Brief overview of the importance of data analysis.
Introduction to key data analysis techniques.
Understanding Scatter Plots
What is a scatter plot?
When to use scatter plots.
Creating and interpreting scatter plots.
Identifying trends, patterns, and correlations in scatter plots.
Hands-On Practice: Creating Scatter Plots
Participants work with sample datasets to create scatter plots.
Discussing practical examples and insights derived from the plots.
Introduction to Chi-Square Analysis
What is the Chi-Square test?
Types of Chi-Square tests (Chi-Square Test of Independence and Chi-Square Goodness of Fit).
When and why to use Chi-Square tests.
Chi-Square Test of Independence
Understanding the contingency table.
Calculating Chi-Square statistic.
Interpreting Chi-Square results.
Chi-Square Test of Independence
Participants perform Chi-Square tests using sample data.
Discussing the significance of the results and drawing conclusions.
Chi-Square Goodness of Fit
Introduction to Chi-Square Goodness of Fit test.
Steps to perform the test.
Interpretation of results.
Real-world examples.
0 Reviews
Riaan is a dynamic leader, coach, facilitator, Lean Six Sigma Master Black Belt with over 20 years of hands-on experience driving business results. Riaan is highly skilled and has worked across diverse industries internationally. With a degree in Chemical Engineering, Riaan started in the major breweries and bakeries in South Africa and was so dedicated to his work that he was often known to take his work home with him.