Histogram
Why use histograms?
Histogram Components
What is a histogram?
When to use histograms in data analysis.
Interpreting a Histogram
Course Content:
Introduction to Histograms
What is a histogram?
Why use histograms?
When to use histograms in data analysis.
Data Preparation:
Identifying the dataset to be analyzed.
Cleaning and preparing the data for histogram creation.
Histogram Components:
Understanding the key elements of a histogram: bins, frequencies, and bars.
Choosing appropriate bin sizes.
Interpreting the shape of a histogram.
Creating a Histogram:
Steps to construct a histogram manually or using software (e.g., Excel, Python, R).
Customization options for histograms (e.g., adjusting bin widths, colors).
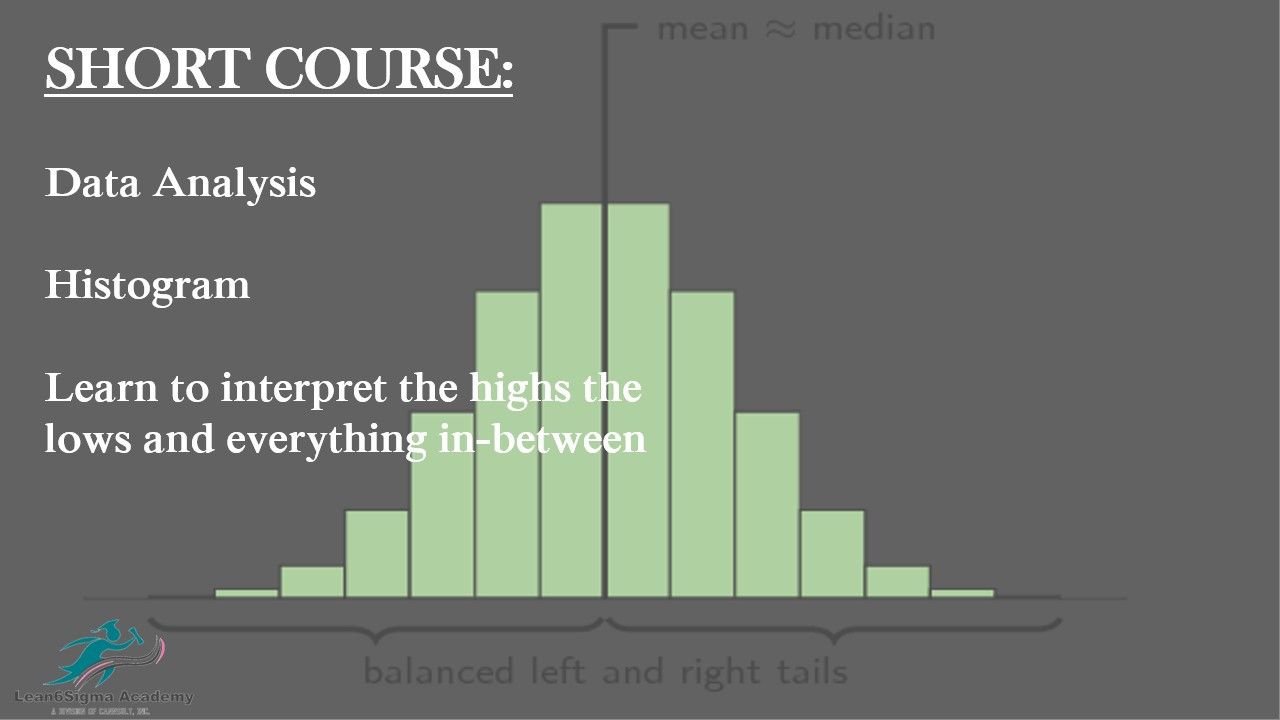
Interpreting a Histogram:
Analyzing a histogram to understand the distribution of data.
Identifying central tendencies, variability, and skewness in the data.
Hands-On Practice: Creating and Interpreting Histograms
participants work with sample datasets to create and interpret histograms.
Discussing practical examples and insights.
Histogram Types:
Introduction to different types of histograms, including frequency histograms, relative frequency histograms, and cumulative histograms.
Real-World Applications
Sharing case studies and real-world examples of using histograms in various fields (e.g., finance, healthcare, marketing).
Common Mistakes and Pitfalls
Identifying and avoiding errors in histogram construction and interpretation.
Tips for effective use.
0 Reviews
Riaan is a dynamic leader, coach, facilitator, Lean Six Sigma Master Black Belt with over 20 years of hands-on experience driving business results. Riaan is highly skilled and has worked across diverse industries internationally. With a degree in Chemical Engineering, Riaan started in the major breweries and bakeries in South Africa and was so dedicated to his work that he was often known to take his work home with him.