One Point Lesson
Getting Organized
Ideas categories
Leadership
Affinity Diagram
Brain storming
Lean six sigma
Data analysis
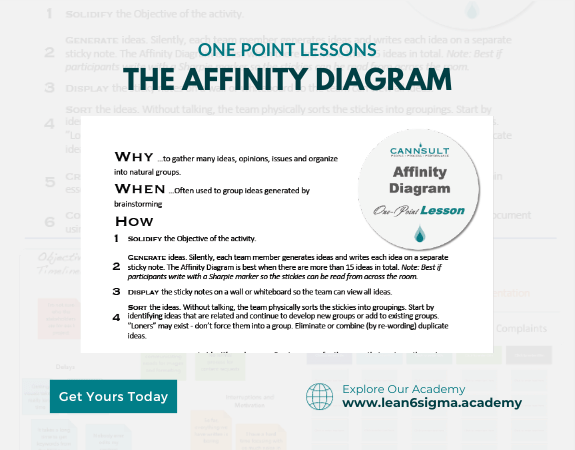
An affinity diagram is a tool used to organize data gathered from a brainstorming session, research, meeting, etc. under meaningful categories that are based on common relationships or themes. These themes are referred to as affinity sets or affinity groups. It simplifies analyzing complex data by grouping them, which helps bring out connections among them and identify patterns 1.
If you’re interested in learning more about the affinity diagram and how to create one, you can check out this guide which provides a step-by-step process for creating an affinity diagram. It also includes some useful tips and examples to help you get started.
0 Reviews
Riaan is a dynamic leader, coach, facilitator, Lean Six Sigma Master Black Belt with over 20 years of hands-on experience driving business results. Riaan is highly skilled and has worked across diverse industries internationally. With a degree in Chemical Engineering, Riaan started in the major breweries and bakeries in South Africa and was so dedicated to his work that he was often known to take his work home with him.