Fishbone
Cause and Effect
Simple yet effective!
Ishikawa
Problem-solving
Primary problem solving
A Fishbone Diagram is a visual tool that helps identify and analyze the root causes of a problem by exploring potential contributing factors.
Description:
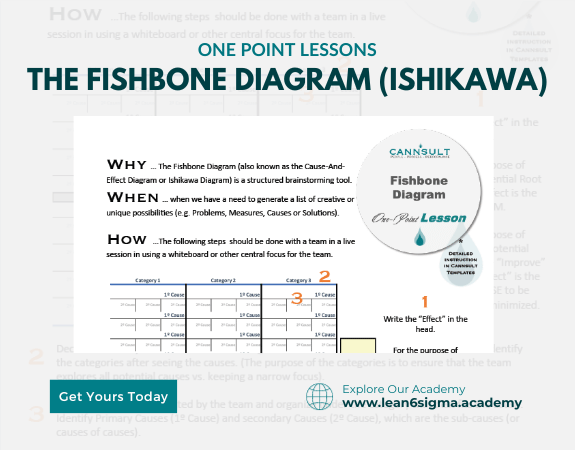
A Fishbone Diagram, also called an Ishikawa Diagram or Cause-and-Effect Diagram, is a graphical representation used to visually map out the possible causes leading to a specific problem or outcome. It's a valuable tool for problem-solving and root cause analysis.
Steps:
Define the Problem: Clearly define the problem you're trying to address. This will be the "head" of the fishbone.
Identify Major Categories: Determine the main categories of potential causes related to the problem. These are the "bones" of the fishbone. Common categories include People, Process, Equipment, Materials, Environment, and Management.
Brainstorm Potential Causes: Under each category, brainstorm and list all the possible causes contributing to the problem. Encourage open and collaborative thinking.
Analyze and Group: Review the list of potential causes and group similar ones together. This helps organize the analysis and identifies patterns.
Identify Root Causes: Analyze the grouped causes to identify the underlying root causes. These are the factors that, if addressed, can help solve the problem.
Verify and Validate: Validate the identified root causes by seeking input from team members or using data and evidence.
Benefits:
Systematic problem-solving
Visual representation of causes
Root cause identification
Collaboration and team engagement
Key Takeaway:
The Fishbone Diagram is a powerful tool for analyzing the causes of a problem, enabling teams to identify root causes and make targeted improvements. It encourages collaboration and structured thinking in problem-solving efforts.
0 Reviews
Riaan is a dynamic leader, coach, facilitator, Lean Six Sigma Master Black Belt with over 20 years of hands-on experience driving business results. Riaan is highly skilled and has worked across diverse industries internationally. With a degree in Chemical Engineering, Riaan started in the major breweries and bakeries in South Africa and was so dedicated to his work that he was often known to take his work home with him.