The Pareto Chart Template
Detect problems early!
Determine the frequency
Resource allocation
80/20 Rule
Data analysis
Make more informed decisions
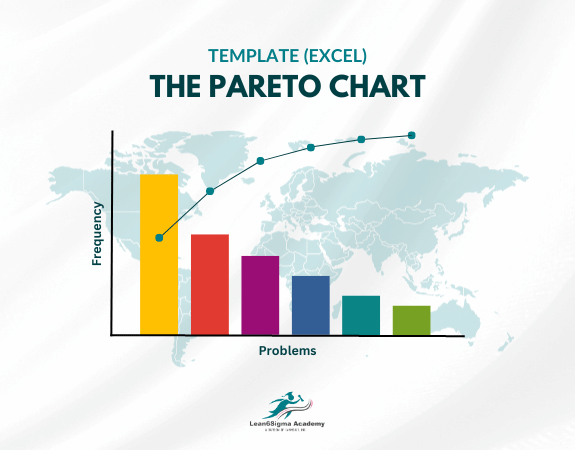
The Pareto Chart Template includes the following components:
Vertical Bars: The central feature of the chart is a set of vertical bars, with each bar representing a specific category, factor, or cause. The bars are arranged in descending order from left to right based on the frequency or impact of each category.
Categories or Factors: The horizontal (X) axis of the chart displays the categories, factors, or causes contributing to the issue or problem. These categories are listed in order of decreasing importance, based on their contribution.
Frequency or Impact: The vertical (Y) axis represents the frequency, count, or impact of each category. The scale can be absolute (e.g., the number of occurrences) or relative (e.g., the percentage of total occurrences).
Cumulative Percentage Line: A cumulative percentage line or curve is often added to the chart. It shows the cumulative contribution of each category to the total. The curve helps identify the point at which the most significant factors account for a substantial portion of the total.
Threshold Line: In some cases, a threshold line may be added to the chart to highlight a specific percentage at which the most critical factors should be addressed. This line can serve as a visual guide for decision-making.
Title and Labels: The chart typically includes a title describing the dataset or issue being analyzed, labels for the X and Y axes, and any necessary additional information.
Pareto Charts are valuable for several purposes, including:
Identifying Priorities: They help teams and organizations identify the most critical issues or factors that need attention and prioritize improvement efforts accordingly.
Focusing Resources: Pareto Charts guide resource allocation and decision-making by highlighting the areas where interventions are likely to have the most significant impact.
Problem-Solving: They assist in root cause analysis by pinpointing the factors that contribute most to a problem or issue.
Continuous Improvement: Pareto Charts are commonly used in Lean Six Sigma and quality improvement methodologies to drive continuous improvement initiatives.
This Pareto Chart Templates has been created using Microsoft Excel.
By applying the Pareto principle, organizations can make more informed decisions about where to invest their time, effort, and resources to achieve the greatest improvement in processes and outcomes.
0 Reviews
Riaan is a dynamic leader, coach, facilitator, Lean Six Sigma Master Black Belt with over 20 years of hands-on experience driving business results. Riaan is highly skilled and has worked across diverse industries internationally. With a degree in Chemical Engineering, Riaan started in the major breweries and bakeries in South Africa and was so dedicated to his work that he was often known to take his work home with him.