Scatter Plot
Analyze scattered data
Decision making with data and facts
Visual representation of Data
Identify patterns
Visual Management
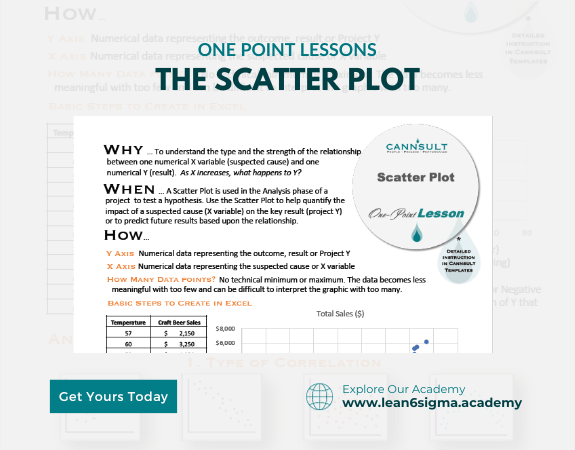
A Scatter Plot is a graphical tool used to visualize and analyze the relationship between two continuous variables, helping identify patterns, correlations, and outliers.
Description:
A Scatter Plot is a simple, yet powerful visualization technique used in data analysis to examine the relationship between two continuous variables. It displays data points as individual dots on a graph, making it easy to identify patterns and trends.
Steps:
Collect Data: Gather data that represents two continuous variables you want to analyze. These variables can be measurements, quantities, or values.
Choose Axes: Decide which variable will be plotted on the x-axis (horizontal) and which one on the y-axis (vertical). The choice may depend on the research question or hypothesis.
Plot Data Points: Place each data point on the graph, with its x-coordinate corresponding to one variable and its y-coordinate corresponding to the other variable.
Analyze the Scatter Plot:
Pattern Recognition: Examine the scatter plot for patterns. Common patterns include:
Positive Correlation: Data points tend to move upward from left to right.
Negative Correlation: Data points tend to move downward from left to right.
No Correlation: Data points appear randomly scattered.
Outliers: Identify any data points that fall far away from the main cluster of points. These may be outliers that need further investigation.
Add a Trendline (Optional): If you notice a clear trend in the scatter plot, you can add a trendline (regression line) to quantify and describe the relationship between the variables.
Label Axes: Label the x-axis and y-axis with the names of the variables and their units of measurement.
Title the Plot: Provide a descriptive title that summarizes the purpose of the scatter plot.
Interpret Results: Based on the pattern and trends observed, draw conclusions about the relationship between the two variables. Is it positive, negative, or nonexistent?
Benefits:
Visual representation of relationships between variables
Identification of patterns, correlations, and outliers
Data-driven decision-making
Hypothesis testing and exploration.
Key Takeaway:
A Scatter Plot is a valuable tool for visualizing the relationship between two continuous variables. By analyzing the patterns and trends in the plot, you can gain insights into the nature and strength of their association.
0 Reviews
Riaan is a dynamic leader, coach, facilitator, Lean Six Sigma Master Black Belt with over 20 years of hands-on experience driving business results. Riaan is highly skilled and has worked across diverse industries internationally. With a degree in Chemical Engineering, Riaan started in the major breweries and bakeries in South Africa and was so dedicated to his work that he was often known to take his work home with him.